Friday, June 24, 2016


Below is the consumption of Vehicles for test track. The only variables changed was considering 1 vehicle, 150 meters inbetween stops 


6.46103575E+05
J/Car
1.60E+04
W/Car
1.60E+01
Kw/Car
3.82876E+02
Kwh Per Day
1.39750E+05
Kwh Per Year


Flex-02 350W
Symbol
Performance
Nominal Power
W
350
Efficiency
%
13.6559
Maximum Power Current
A
11.33
Open Circuit Voltage
V
38.8
Maximum System Voltage
V
1000/600
Area
m2
2.572
Weight
Kg
2.4


2300m^2-2800m^2


Below is the cost analysis to satisfy this track (accounting for the Miasole panels) and considering different orientations with their specific optimizations. The Helios activator was assumed when calculating the cost and energy consumption of tracking systems.


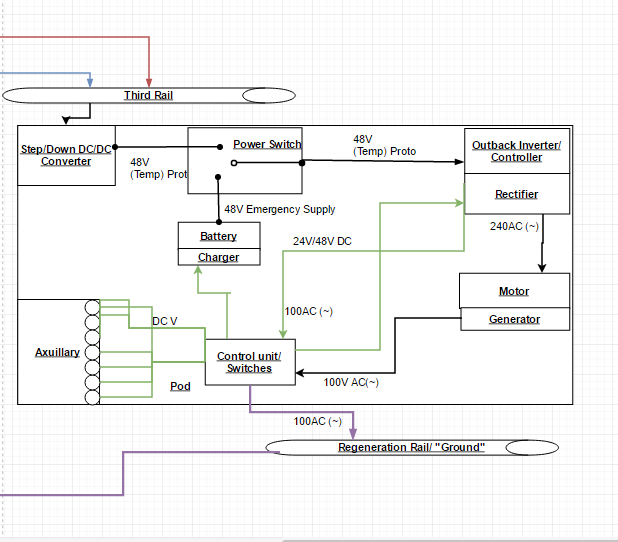
The basic electrical diagram assumes a solar panel array of 1400 DC voltage which inverts (with the same phase as the grid) to an 1100 AC loading voltage. The 1100 AC loading voltage is then forced through a control switch and a series of sub-switches depending on where the voltage is needed in the system. If pods are not consuming all the supplied power, then the 1100 AC voltage will lead to a step-up transformer to charge the grid system. If significant power is being drawn by the pods, then the loading voltage is switched to the Converter/Substation and the 1100 AC voltage converts to a 750 DC voltage. During non-sunlight hours the Grid will unload and the assumed 12,000V AC will step-down to an 1100V AC. The outback charger forces the 1100AC V unloading from the Grid to have the same phase as the inverter. The 1100 AC voltage unloading is then switched into the Converter/Substation the same way it would switch when being loaded by the solar array. 


When the Converter/Substation receives an 1100AC voltage (from the Grid or Solar Array) it outputs 750 DC voltage directly into the Third Rail of our system. The third rail is in turn connected to a step-down DC to DC converter. Assuming that we use an AC motor the converter will be connected to an inverter and the 48DC voltage supplied from the converter will by inverted into a 240AC voltage that directly powers our motor. The regenerative braking system (motor-generator) will go into a control unit which will determine where the voltage is needed. In the case pod components need to be charged, the 100 AC (assumed) voltage from the motor-generator will go into a rectifier that will convert the 100 AC voltage into a 12-48V depending on which component needs to be powered. In the case the Gird and the Solar panels fail, there is a backup emergency battery that will power the motor; most likely, in this case, the regeneration energy will go into power the battery. If all components are working optimally (Battery and Auxiliary) than the control unit will allow the 100AC V to go into the Regeneration Rail/ “Ground”. Unlike many Three or Four rail systems, Spartan Superway designed its regeneration rail and ground rail to be the same, utilizing energy that is lost. The Regeneration would lead into a step-up transformer and charge our grid, completing the circuit of our system.


Friday, June 10, 2016

Solar Team 6/10/2016

Fig. 1) Energy Consumption of Vehicles


 Figure one shows the equation and calculations used to estimate the energy consumed of the vehicles in the superway. It is important to note that this equations takes into account that all the vehicles will be connected in the form of a train, meaning that the wind resistance and drag is not accounted for in every vehicle as it will be in reality. Figure 6 is the edited equation with wind and drag being accounted for in every vehicle.

Fig. 2 SAMS required conditions for annual energy consumption
                                            Fig. 3) SAMS Data of annual energy

Figure two shows the conditions required for our calculated annual energy consumption of 150 Vehicles. The conditions were calculated with a 340W Miasole thin Solar panel, and Exeltech  XLGT18A60 Inverter (120V AC). With an estimated requirement of 6 Million kWh annually SAMS determines we will need approximately 12,500 panels with a total area of 32,189 m^2.

                             Fig. 4) Comparison in Wh/mile with Superway Pod and GM EV1 for 24 miles

Figure 4 is the comparison in Wh/mile. GM EV1 approximated at 50mph and 24 miles that their electric vehicle with use 127watt-hours/mile. When we estimate one Superway pod traveling at 25mph at a distance of 24 miles we calculate 132.5 watt-hours/mile. This comparison allows us to validate that we are in the "ball park" of watt-hours/mile also giving our equation in figure one more credibility.
                Fig. 5) Comparison in Wh/mile with Superway Pod and GM EV1 for 3500meters (2.17miles)

Figure 5 is the comparison in Wh/mile when we are considering the real distance between stops, which is 3500meters instead of 24 miles. We are considering a 20 meters elevation drop and rise before and after the distance in between stops.  Taking into account the abundant acceleration and deceleration (because of the shorter distance in between stops) we calculate a total of 2114 Watt-hours/mile per vehicle. This emphasize the loss of energy form accelerations, deceleration and elevations in our track.


Fig. 6) Consumption of energy per vehicle taking into account wind resistance and drag for each vehicle.

Figure 6 is our estimations of how much energy would be consumed by our vehicles when we look at them as an individual pods instead of a one large train of pods. This of course adds more consumed energy by our vehicles, approximately increased by  1.62*10^5 J per 150 cars annually. SAMS estimates that we would need to add 3,000-4,000 solar panels to account for the extra wind resistance for each vehicle.

     Fig. 7) Energy leftover each day actuator consumption and optimization.

Figure 7 shows the energy leftover each day when was consume energy from the actuators and add optimization from the actuators. The estimation is done assuming the exact panels required to meet the energy consumption by our vehicles (accounting for air resistance) per day. As shown having actuators change twice a year or 4 times a year adds a significant energy production (leftover) per day. The 2-axis tracker does add more efficiency than the fixed panels however considering the energy consumed throughout the day from its tracker and actuator is actually will produce less leftover joules per day than the 2 season and 4 season actuator. The next step for this will to be estimate the costs of the actuators and trackers and determine if the cost is worth the leftover joules per day.